What Is Fibonacci Retracement? How to Use It in Crypto Trading
The Fibonacci retracement tool is widely used in technical analysis to predict possible future prices in the crypto market. It is a confirmation tool that can help you get better trading results when used with other indicators and this is how to use Fibonacci retracement tool in cryptocurrency trading.
What is the Fibonacci retracement?
The Fibonacci retracement is a key crypto trading technical analysis tool that provides insight into when to execute and close trades, or to place orders and limits. The indicator uses percentages and horizontal lines to identify key support and resistance points during an uptrend or downtrend. You can use it as part of a crypto trading strategy.
The price does not move in a straight line; it undergoes a series of pullbacks, forming something of a zigzag pattern. For example, in an uptrend, price doesn’t move straight up; it moves up and returns before continuing the upward movement. This pattern occurs continuously within a trend.
Many crypto traders use the Fibonacci retracement tool to look for possible places where a price decline could find support or resistance. A pullback, also known as a retracement, is a temporary reversal in the crypto market trend. It differs from a reversal in that it is just a short-term move against the trend followed by a continuation of the ongoing trend.
Understand Fibonacci Numbers
Fibonacci is all about numbers, and these are the key numbers to look out for.
The Fibonacci Sequence
The Fibonacci number sequence was discovered by Leonardo Pisano, also known as Fibonacci. He documented them in his book, Liber Abaci“The Book of Numbers” which he published in 1202. The sequence of numbers is as follows: 0, 1, 1, 2, 3, 5, 8, 13, 21, 34, 55, 89, 144, etc.
The series is derived by adding the two connected numbers to form the next one. With that in mind, you can assume that the next three numbers in the sequence will be 233, 377, and 610.
Golden Fibonacci Ratio
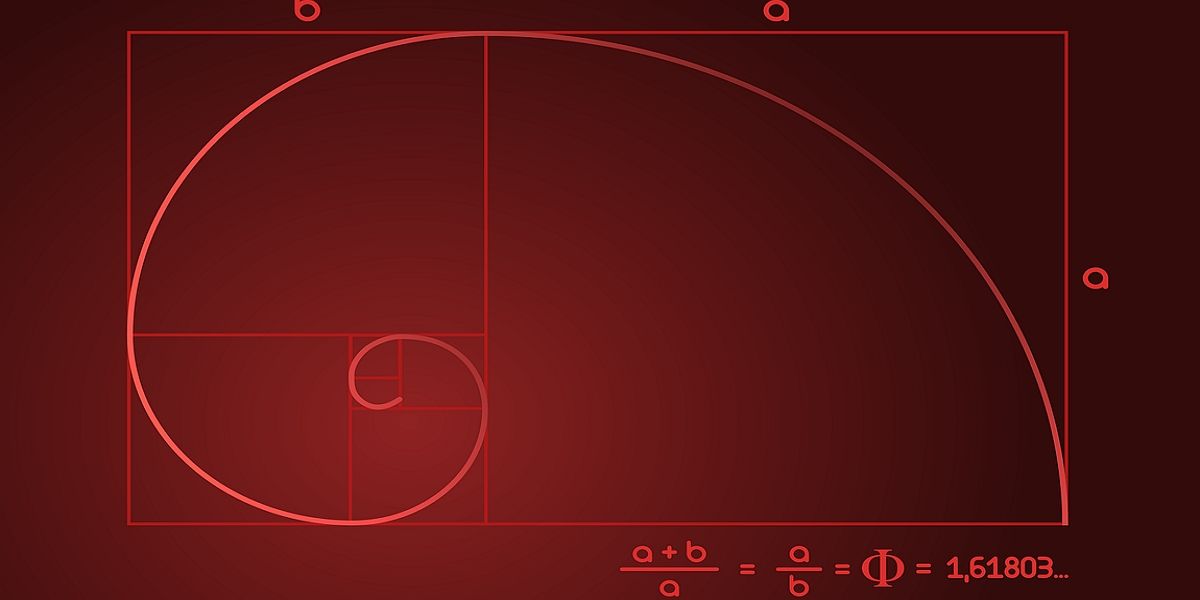
One of the notable things about the sequence is the relationship between the numbers. Each number is approximately 1.618 times larger than the previous number. The derivative of 1.618 is known as the golden ratio. The term “golden ratio” is based not only on the derivation of the sequence, but also on the fact that the ratio is reflected in almost everything around us.
The Fibonacci numbers appear in DNA molecules, reproductive patterns, cyclone patterns, branches, etc. For example, if you look closely at flower petals, you will see that an intact buttercup has five petals and lilies have three, which are Fibonacci numbers.
Using Fibonacci numbers in cryptocurrency trading
Just as Fibonacci numbers are evident in everything around us, so are they in trading. Crypto traders use the Fibonacci retracement tool to identify support and resistance points during trading. The tool consists of numbers derived from the differences between the numbers in the sequence. The numbers include 0.236, 0.382, 0.618 and 0.786.
We’ve already described how the ratio 0.618 is created: by dividing one number by the number before it. Dividing a number by another two digits higher in the sequence equals approximately 0.382. For example, dividing 21 by 55, 89 by 233, and 233 by 619 gives approximately 0.382.
Using the same pattern, dividing a number by another number three digits higher in the sequence gives approximately 0.236. The ratios 0.236, 0.382, 0.618 and 0.786 are formed from the difference of the numbers. They can also be expressed as a percentage as 23.69%, 38.2%, 61.8% and 78.6% respectively.
Another important number commonly used in Fibonacci retracement is 0.50 or 50%. It is not derived from the Fibonacci numbers, but it has been considered an important point for a likely reversal based on other theories.
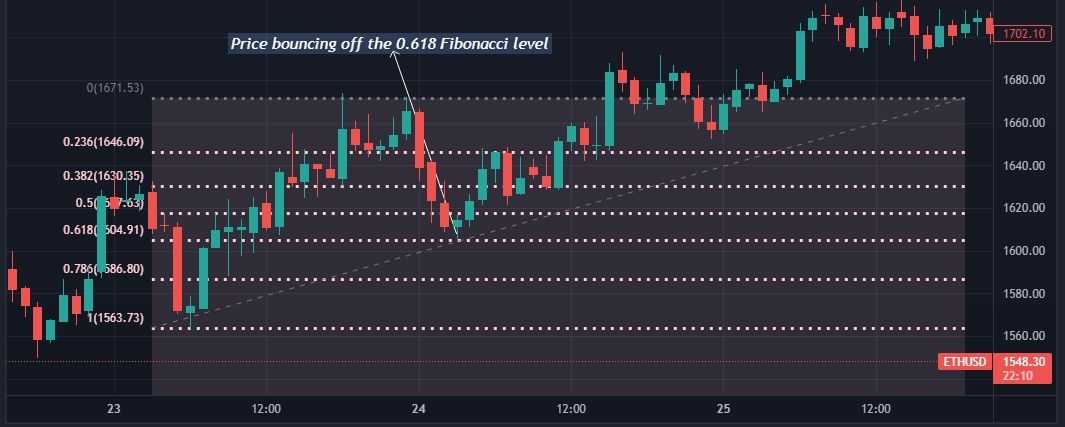
From the image above, we can see that the price bounced off the 0.618 Fibonacci level and the uptrend continued. The 0.618 Fibonacci level served as support for the price on the chart.
Applying Fibonacci retracement to your crypto trades
The Fibonacci retracement tool is relatively easy to use. You just have to select low and high price swings relevant to your analysis and the price you are trading at.
The selection of the two points must be done carefully to get an accurate measurement. In an uptrend, you need to attach the tool to the lowest relevant price of the low volatility and connect it to the highest relevant price of the high volatility. Conversely, in a downtrend, you need to connect it to the highest and lowest relevant prices from the last trend. As simple as this may seem, if you don’t do it exactly, you’ll get the wrong result.
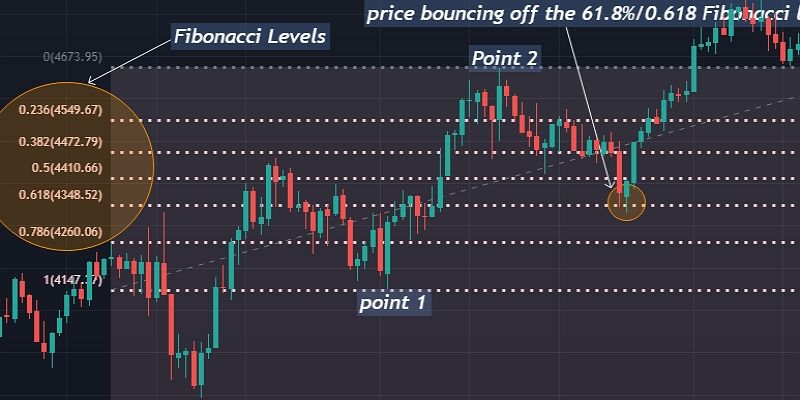
The chart above shows how to use the Fibonacci retracement in an uptrend. We drew the line from point 1 to point 2. The two points are the important high and low before the retracement. The price then returns and bounces off the 61.8% (0.618) Fibonacci level to continue higher.
In the example above, we pulled the Fibonacci line up. In the event of a downtrend, we would draw the line down. In other words, in an uptrend, you should draw the Fibonacci line from the low of the last relevant swing to its high. In a downtrend, it’s the other way around.
The information you get from the retracement levels will help you determine possible support and resistance points, and what you do with such data depends on your trading strategy.
Using the Fibonacci retracement in trend trading
Many traders use the Fibonacci retracement levels in combination with the trend line and other technical indicators as part of their trend trading strategy. They use the combination to make low-risk entries into an ongoing trend and form a confluence that helps make better trading decisions.
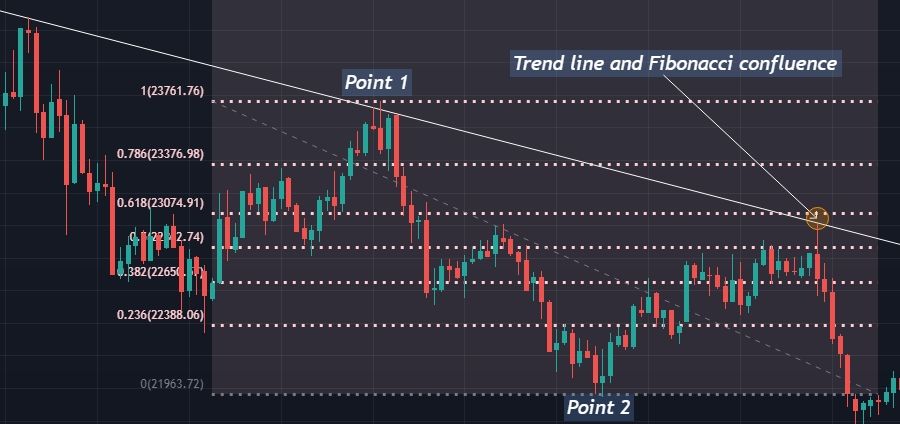
When trading trends, traders expect the trendline to form resistance in the case of a downtrend and support in the case of an uptrend, causing price to bounce off the trendline several times. Although there is no certainty that the trend line will work as expected, drawing a Fibonacci retracement line can serve as an additional indicator to check the possibility of a trend continuation after the price hits the trend line.
The chart above shows that the price bounced off the trend line several times. Let’s consider a case where the trader is unsure whether the trend line would continue to serve as resistance prior to the third bounce in the image above. The trend line has a confluence with a strong Fibonacci line, which would have given the trader more confidence to execute the trade. The following trend continuation would not have come as a surprise.
How you use the Fibonacci retracement depends on your crypto strategy
You can also use the Fibonacci Retracement tool with other technical indicators including candlestick patterns, oscillators, volume dynamics, moving averages, etc. Some people use it with price action to trade trend reversals and counter trend trading strategies. These traders don’t wait for the price to hit Fibonacci retracement support or resistance, instead using the levels to determine when to lock in their profit. Some other people also consider the Fibonacci retracement tool to be confusing and a waste of time and prefer not to use it.
We used the 61.8% Fibonacci level in all the charts we used as examples. However, the levels to use depend on your strategy. You can build your crypto trading strategy around different Fibonacci levels as it works for you. It’s up to you to figure out how best to use this technical tool to get the best crypto trading result.


