How to Create an Affinity Diagram Using Google Jamboard
Generating ideas can be overwhelming. Sorting through these ideas can be even more overwhelming. Luckily, there are a number of tools and techniques that can help you remove the excess noise to find the core idea or topic in a set of information.
To sort your ideas and find common themes to generate next steps, consider using a common diagram tool: the affinity diagram.
What is an affinity diagram?
A diagram tool to solve problems and get ideas is an affinity diagram. An affinity diagram is an organizational tool used to sort ideas and data based on their relationships to each other. Affinity diagrams are used to brainstorm and find patterns in data.
To create an affinity diagram, first jot down ideas and observations on individual note cards (or something similar, such as sticky notes). Next, look for common themes among the note cards. Finally, sort the note cards into groups with common themes.
While you can create affinity diagrams by hand, it is often more effective to create them digitally. One of the best options for creating digital affinity diagrams is Google Jamboard because you can use Google Jamboard for visual collaboration from anywhere.
1. Create sticky notes in Jamboard
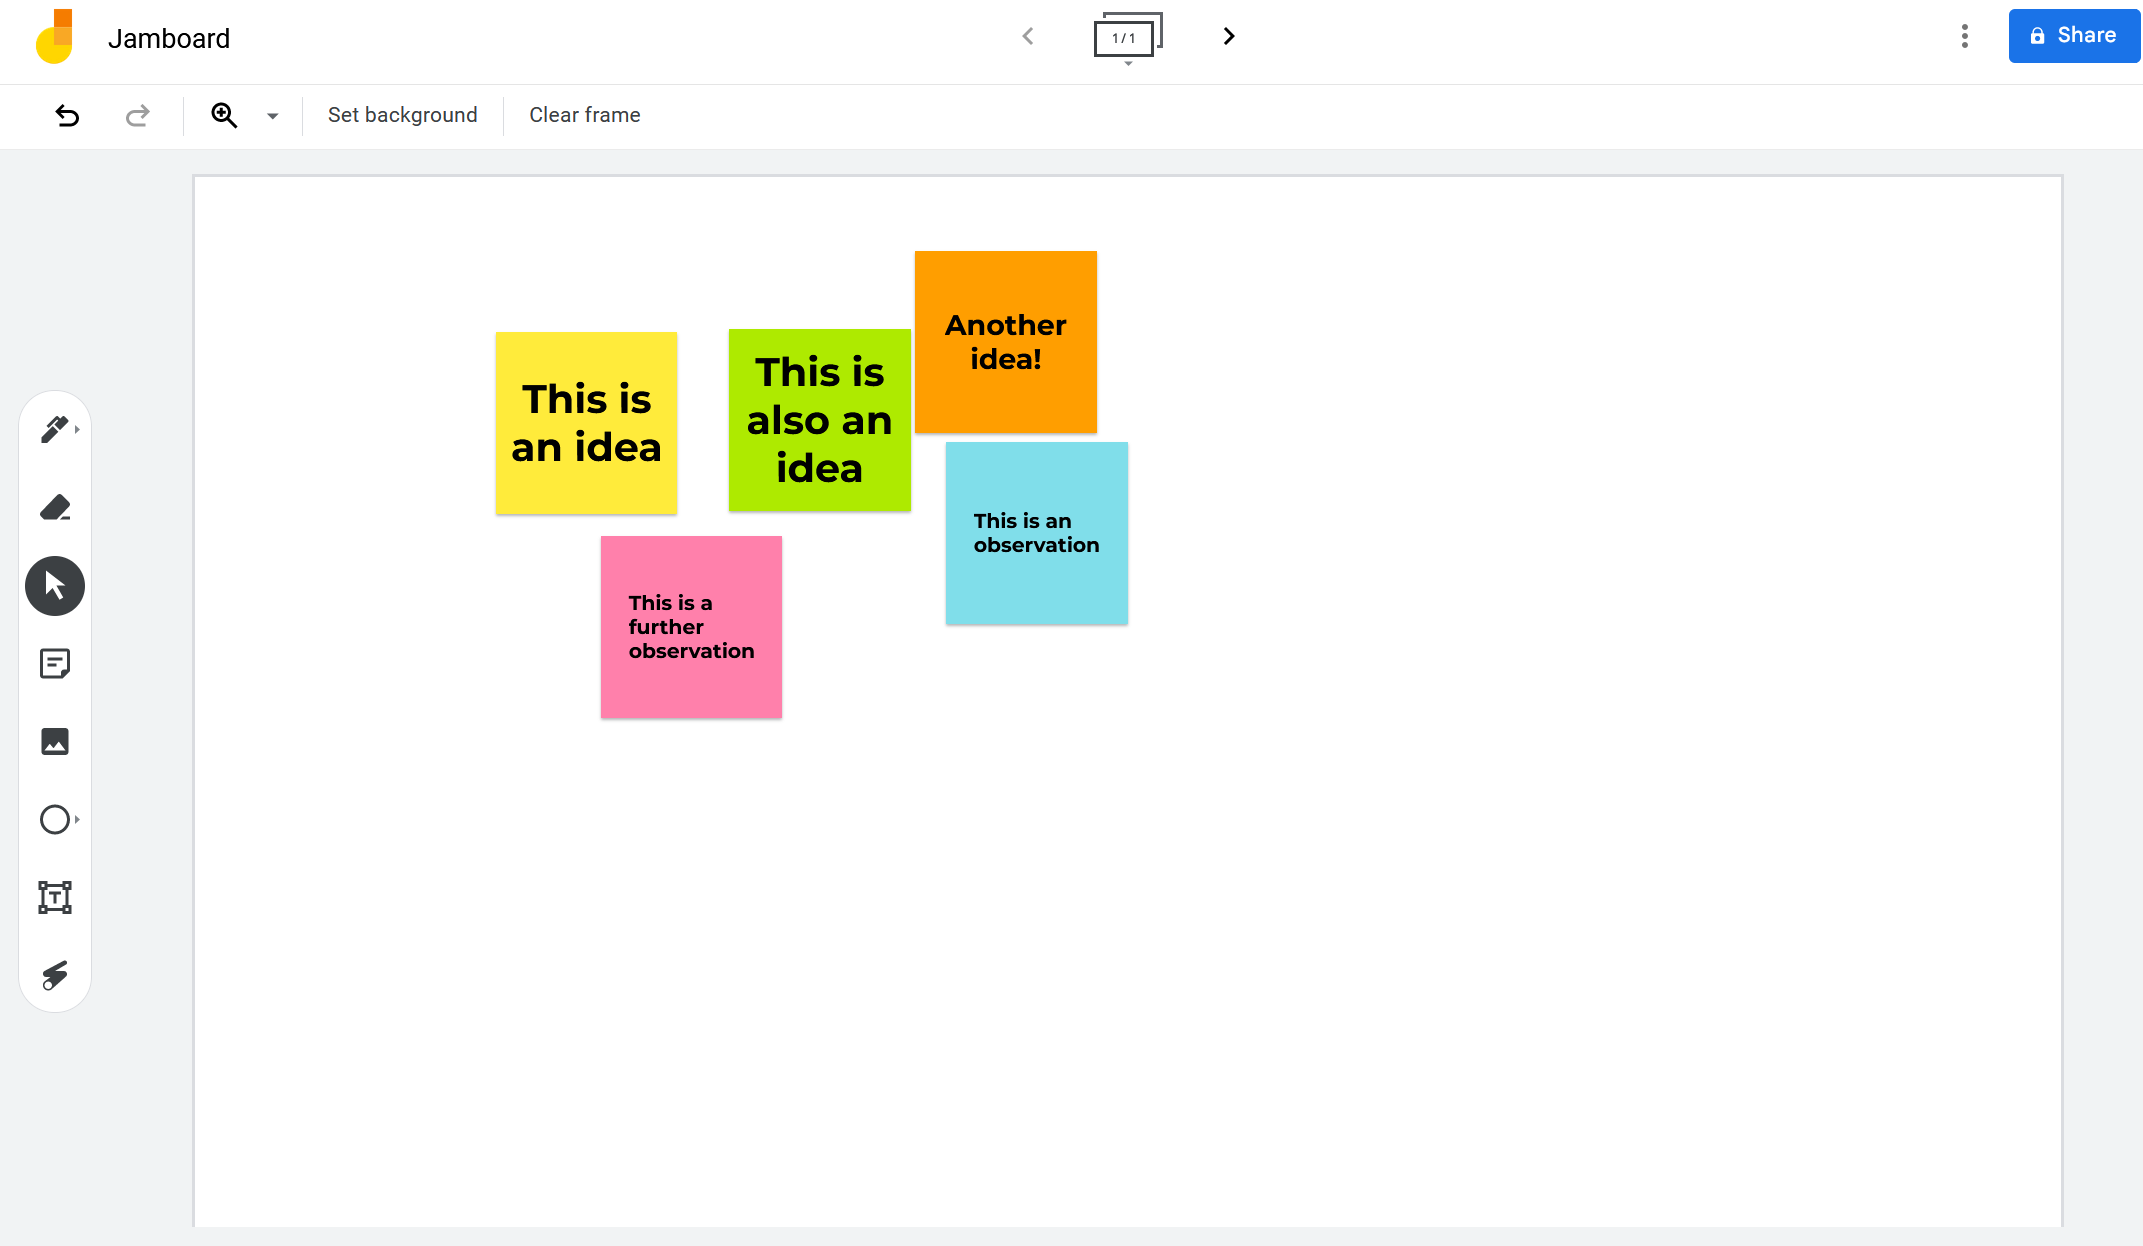
To start creating an affinity diagram, you must first create sticky notes in Google Jamboard. To do this, click on the Self-stick note icon on the left side of the screen. Or you can use the keyboard shortcut CTRL + Shift + P. You should only write one idea or observation on each sticky note.
Jamboard offers sticky notes in five different colors to choose from. You can place all of your ideas on sticky notes in one color, but it’s often helpful to create sticky notes in different colors so you can visually differentiate ideas.
Once you’ve recorded all of your ideas and observations, you should have several sticky notes (each with just one idea or observation written on them) on your Jamboard to start categorizing.
2. Create idea categories
After you’ve created all your sticky notes, it’s time to look for common patterns in the data. Ask yourself, “What are the similarities between these notes?” and “Where do I see common themes?”
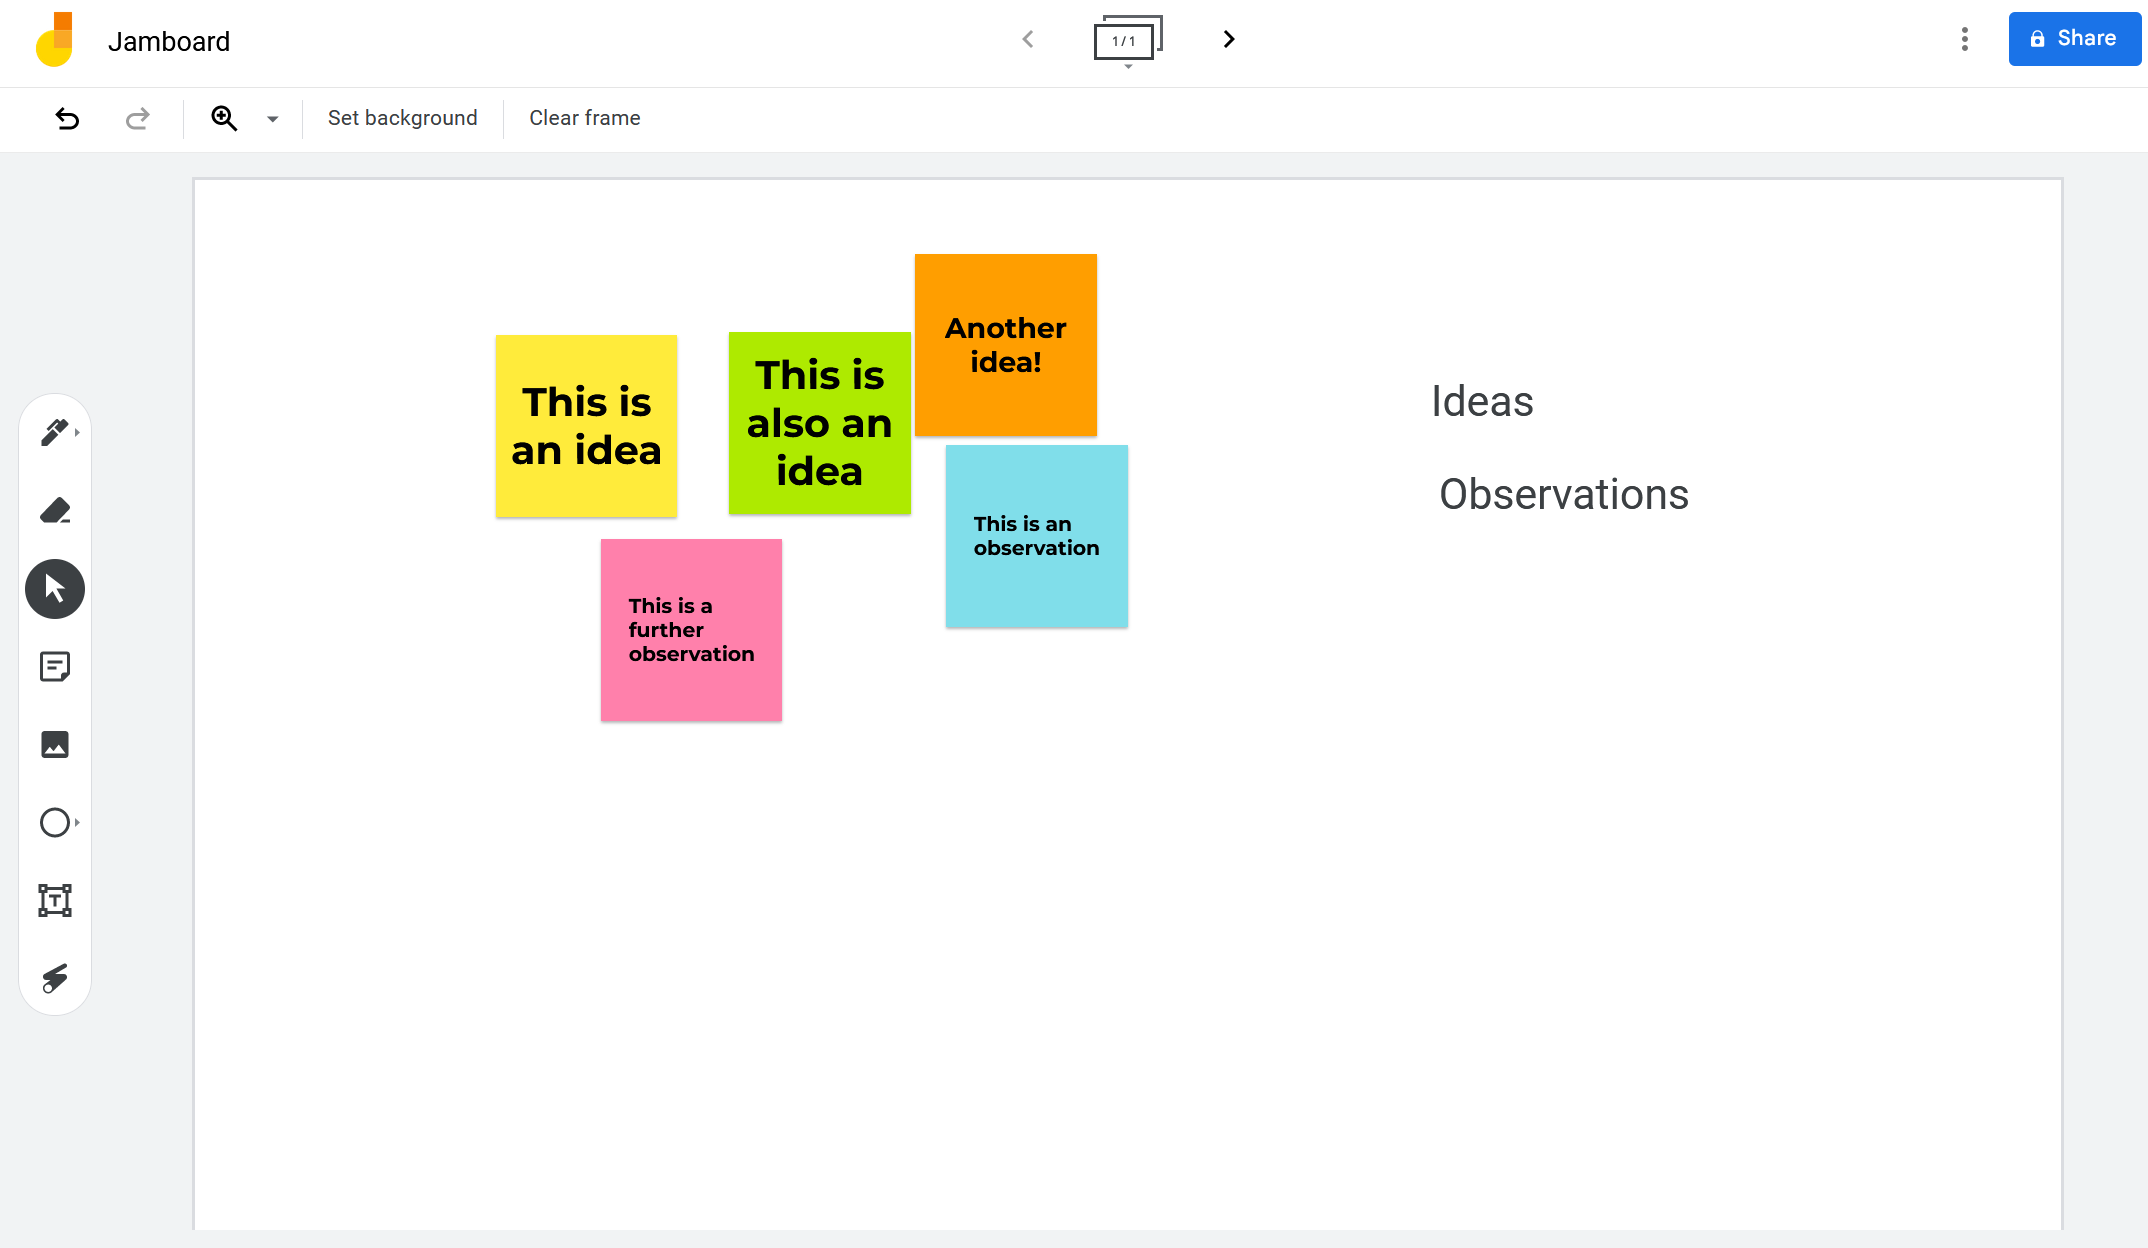
Write down the common themes, similarities, and patterns you see. This is important to complete the next step. You can add a list of topics to your Jamboard by clicking text box icon on the left side of the screen.
You may find that you don’t use all the topics that you write down. That’s okay! At this stage it is only important to make a list of possible patterns.
3. Organize sticky notes into categories
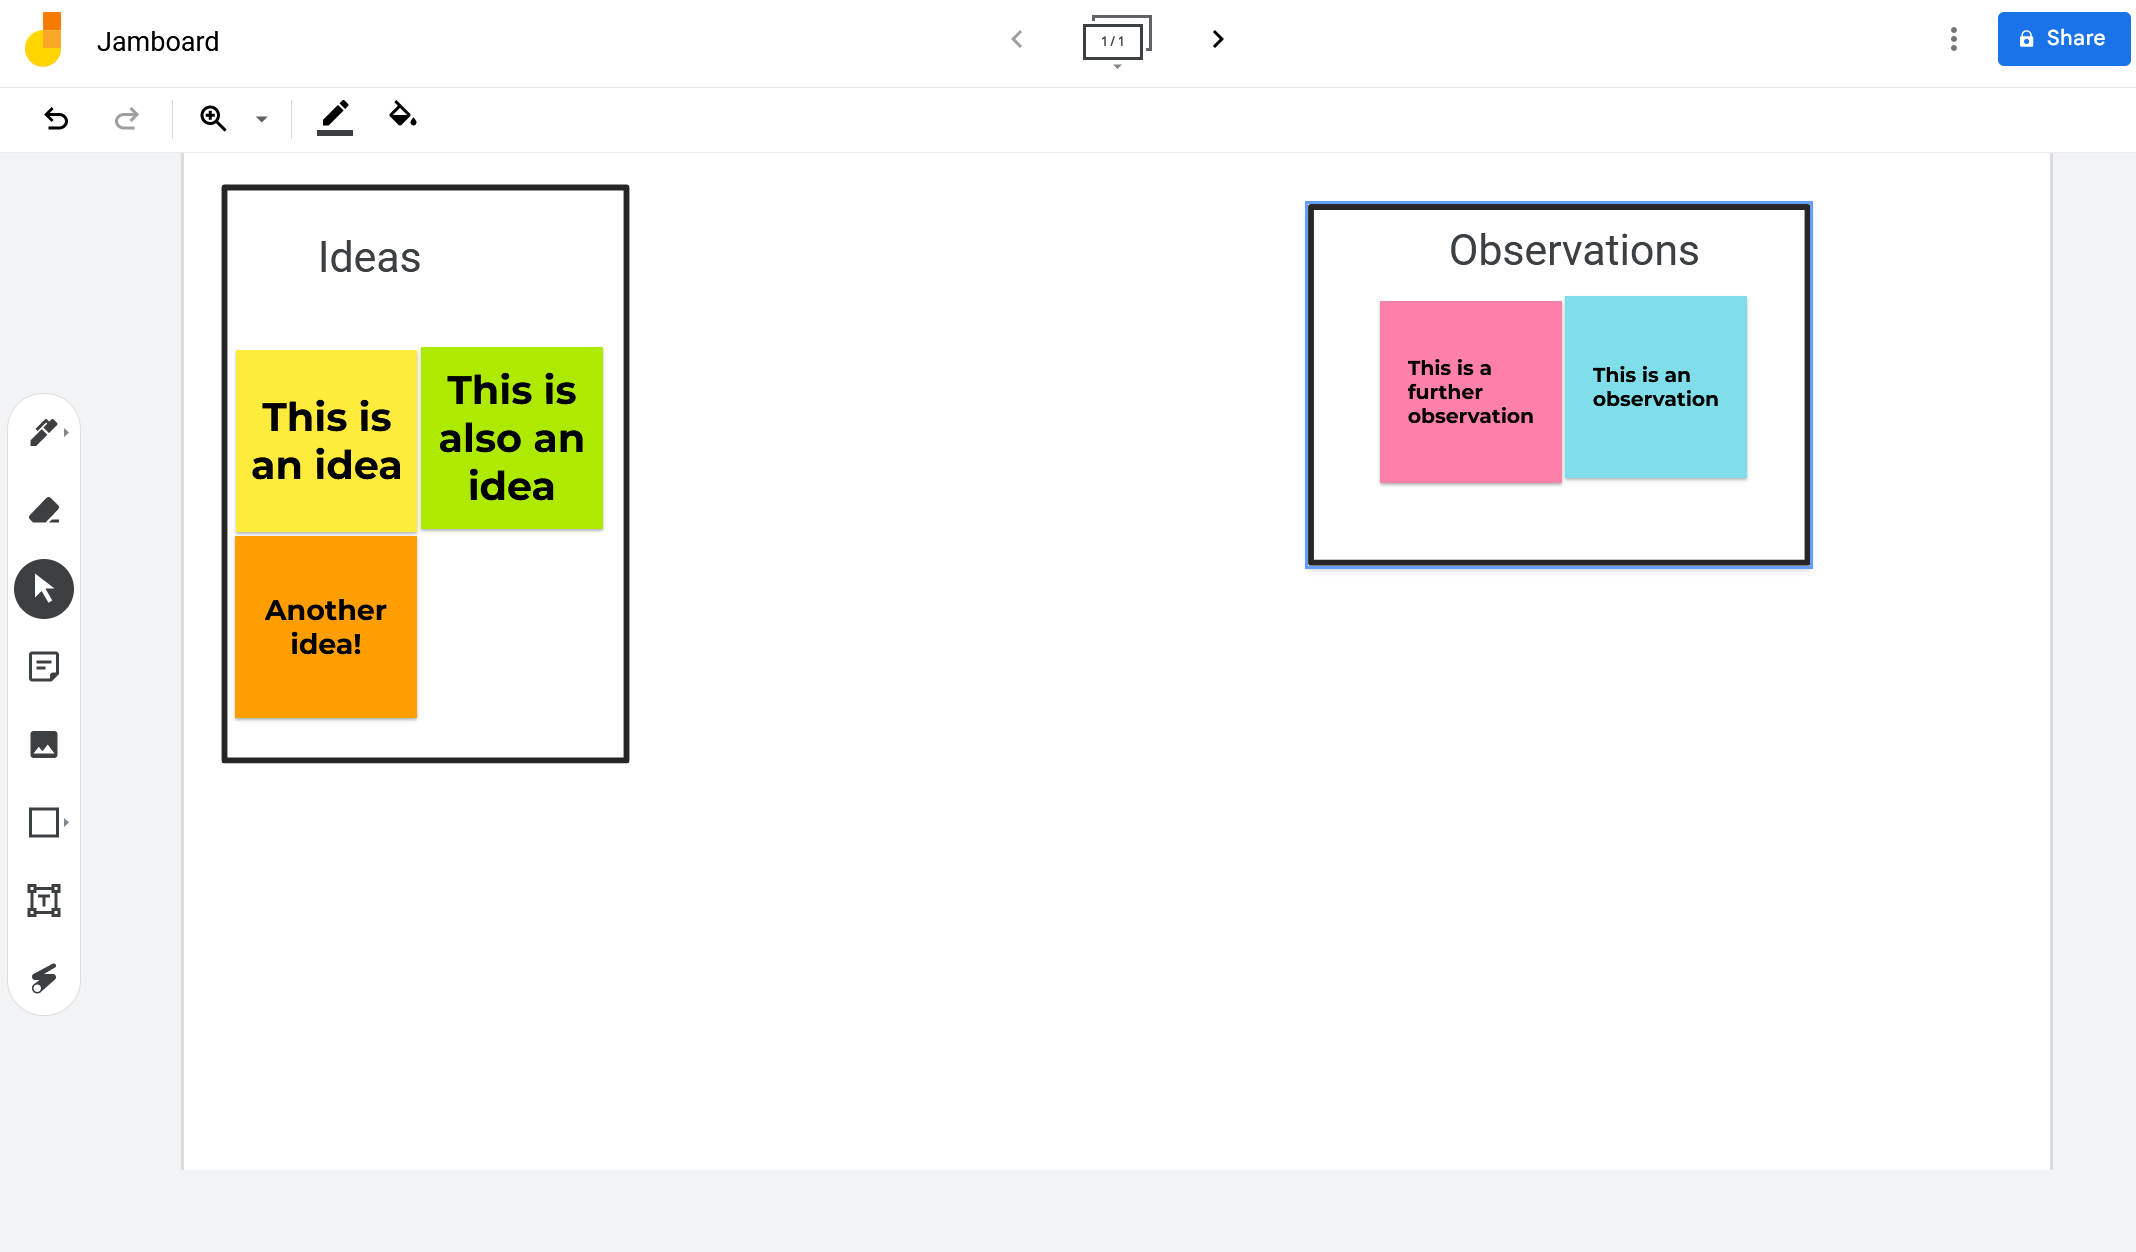
Once you have a list of themes and patterns, it’s time to sort the sticky notes into groups. Create a heading for each topic or pattern using text box Symbol. Next, place the sticky notes under the appropriate heading.
Once all of the sticky notes are organized, create frames around each category. You can do this by clicking the shape icon on the left side of the screen. You need to right click on the shape and select commandthen Send to the back. This keeps the shape from blocking your sticky notes but allows you to keep the border.
Now that you have a visual representation of the common themes within the ideas and data, you can begin the next steps in your project. When you see patterns in front of you, it’s easier to figure out what actions need to be taken to move your project forward.
Affinity diagrams lead to the next steps
Affinity diagrams are useful when trying to sort through large amounts of information. By breaking down your ideas or observations into individual sticky notes, you can focus on finding similarities in your information instead of being overwhelmed by it.
Once you find those similarities, you can see what the next steps in your project should be, whether that means making changes to a prototype, going back to gather more data, or something else entirely.


